Knowing what’s working – and what isn’t – is vital if you’re looking to scale your affiliate earnings.
Digging into the right performance data makes it easier to find where you can make changes to your content strategy, learn more about your readers, and spot emerging trends – so you can invest your time in content that converts.
Access to data isn’t everything – you need relevant insights to take informed actions and create high-earning content that your readers love. And at Skimlinks, that’s what we deliver.
Nerd out on the numbers
So when it comes to performance, which metrics should you be tracking?
There are lots of data points that show how your content is performing, from page impressions and clicks, right through to sales and revenue.
Skimlinks gives you access to all these metrics, and so many more – including engagement metrics, which show the products your audience wants to buy or learn more about, and sales and commissions metrics, which show what’s driving your revenue. All these metrics help you optimize your content at every stage of the affiliate journey. The metrics include:
- Engagement metrics – impressions, clicks, click-through rate (CTR)
- Sales metrics – total sales, conversion rate, order value
- Commissions metrics – revenue, revenue per mille (RPM), commission rate and earnings per click (EPC – a metric that helps you compare products with different conversion rates and order values, commission rate)
Talk data to me
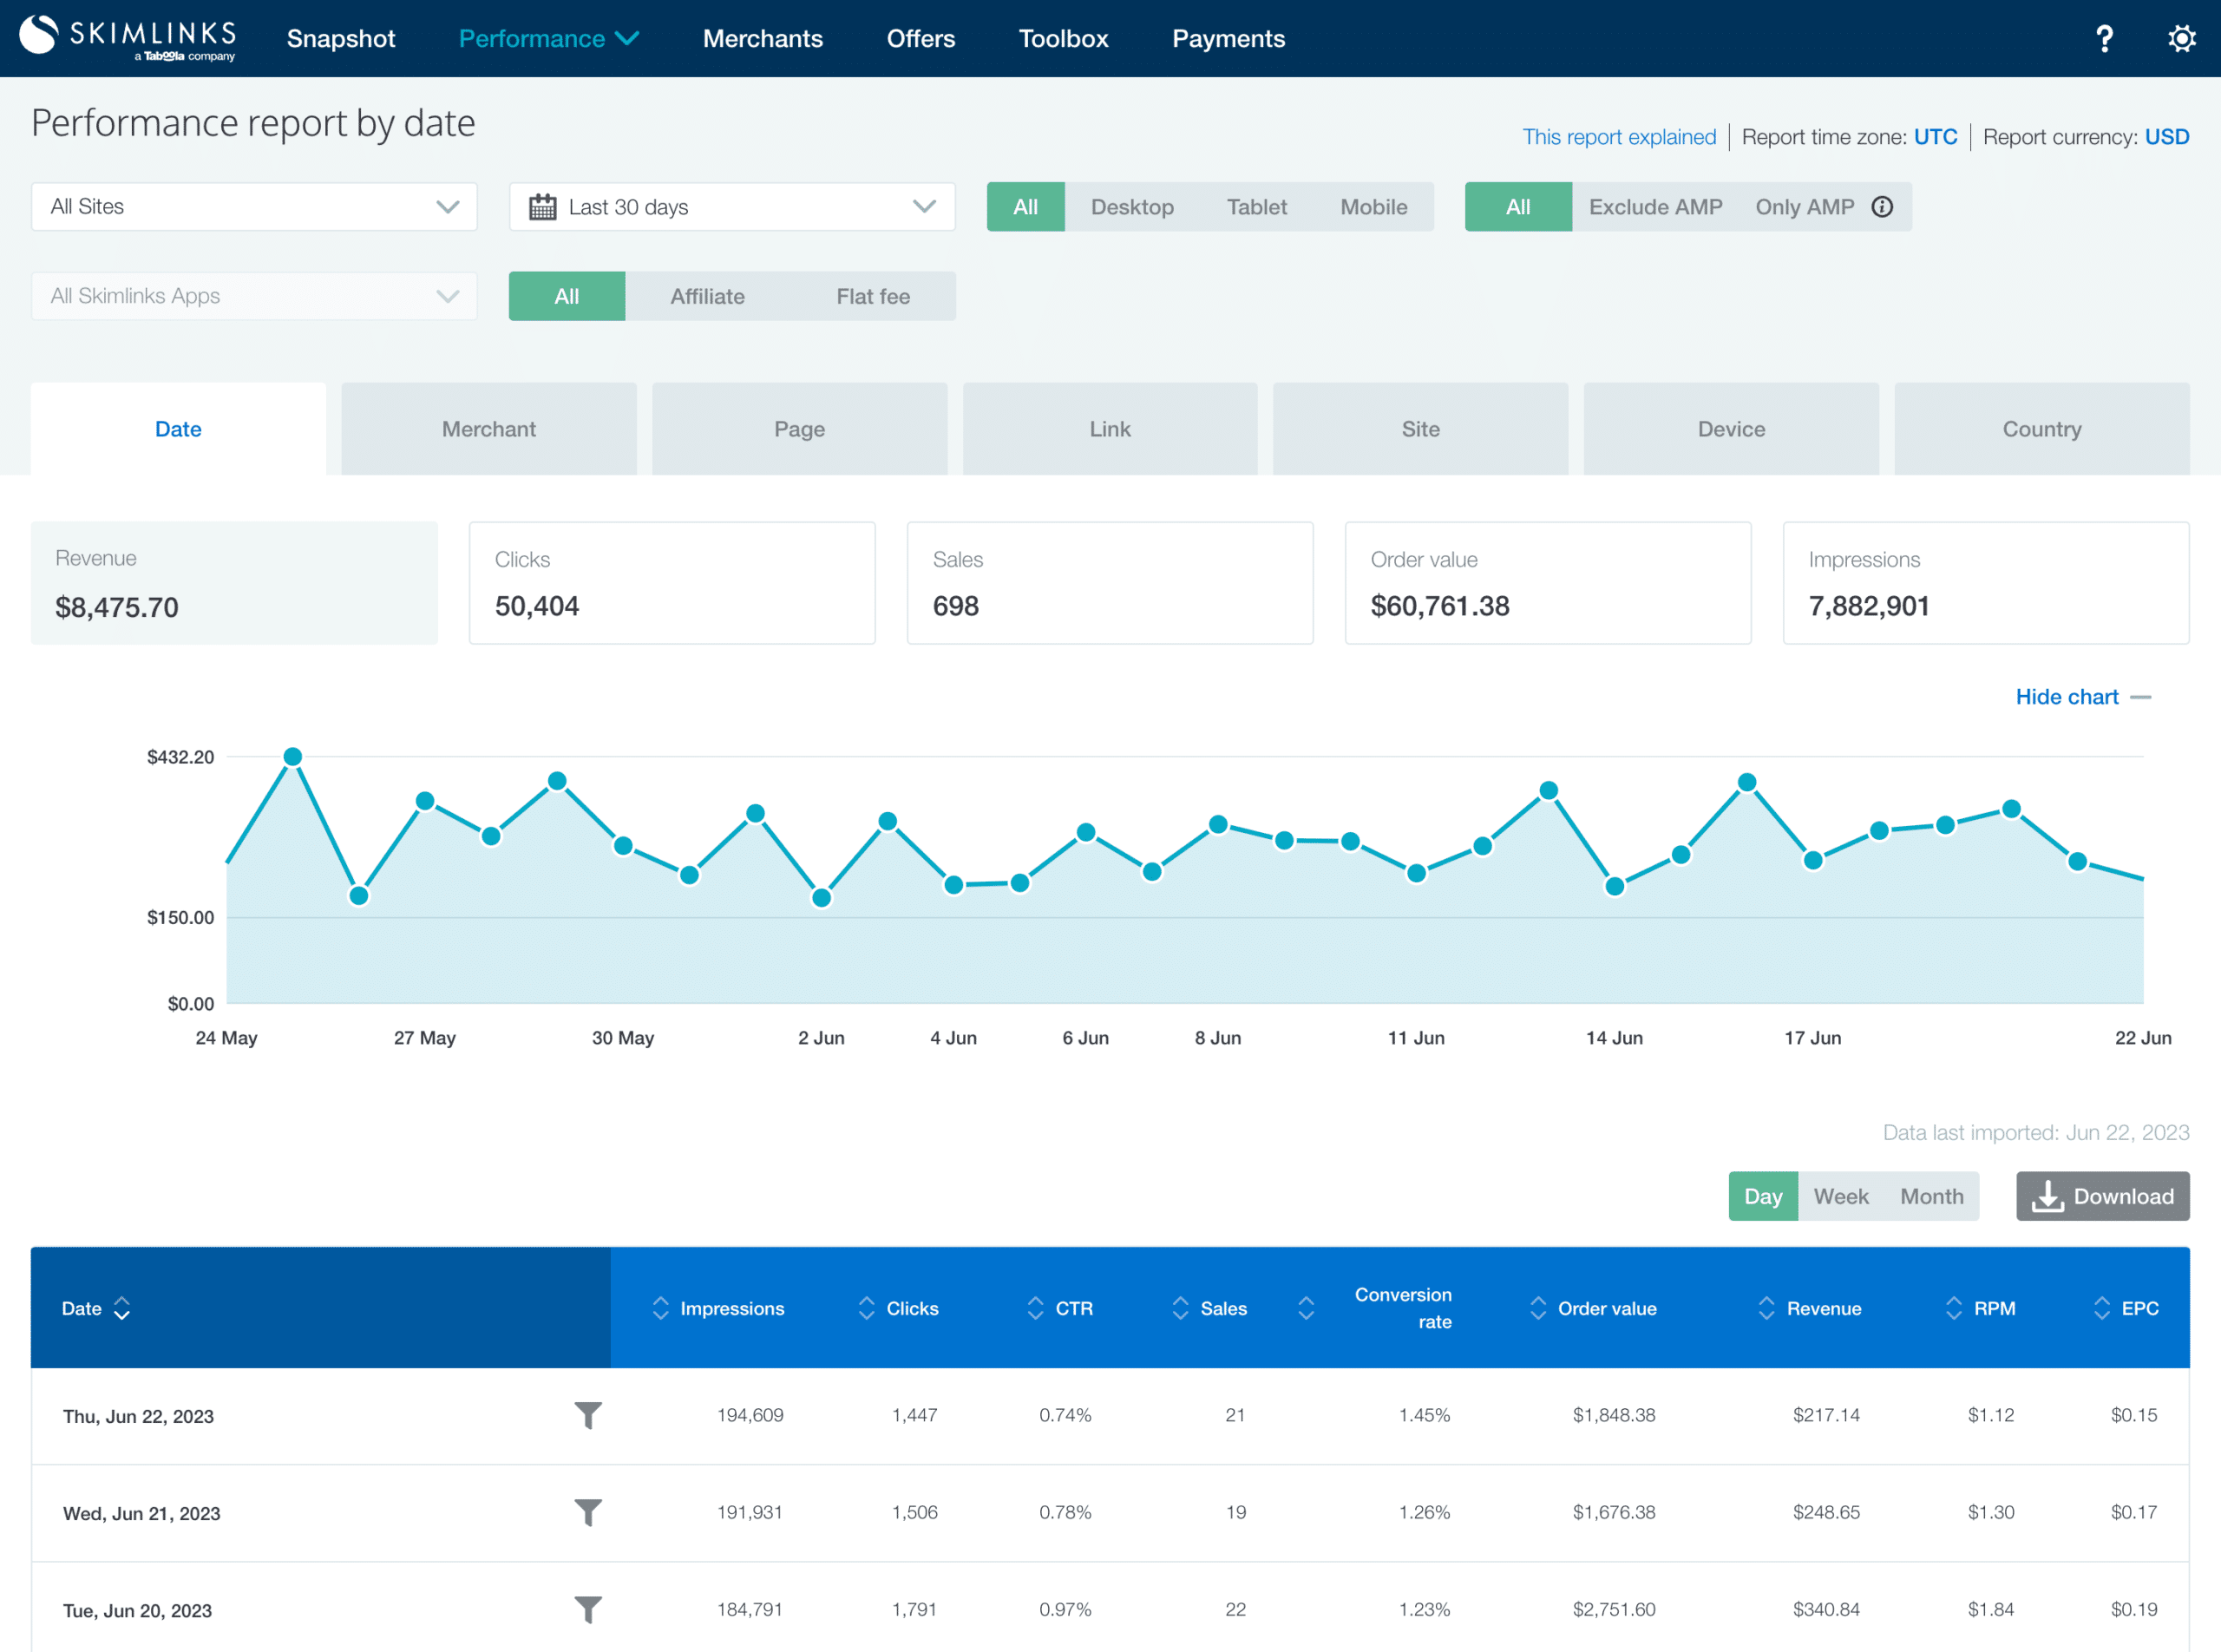
Tracking your affiliate metrics is easy with Skimlinks. Our Performance Reports, available in the Publisher Hub, are a simple all-in-one tool to understand your overall performance. The reports give a clear, visual overview of your performance and how your readers engage with your content.
You can use the reports to dive deeper into the data and measure your performance. Here are our core reports and how you can make the most of them:
- Date – see which days your readers are most engaged and track spikes around key shopping moments, so you can predict and create content for future ones
- Merchant – see which merchants are resonating with your readers and generating the most revenue for you, so you can feature more of their products
- Page – see which of your posts bring the most engagement and commissions and consider sharing them on social or in newsletters to maximize their revenue potential
- Link – see which links are leading to the most conversions to see which products are performing well with your audience. Compare the posts that feature your top links to see if there’s a correlation between page position and clicks.
- Site – get an overview of your performance at site-level, and see how your domains compare to one another
- Device – see which devices your readers use so you can optimize your content for your top devices and push the content to the ones driving the highest conversions
- Country – see which regions drive the most engagement and revenue for your site and make sure you’re including global brands or merchants with international shipping options to cater to them.

Within these reports, you can also compare your performance over different time periods (like Cyber Week YoY).
And if you have something specific you want to track internally – like the author, your content categories, or any other unique IDs – you can use our CustomID field to capture just that. You can also use CustomID to do A/B testing, so you can compare different headlines, images, or whatever you like.
Create, upcycle, optimize, repeat
Alongside our Core Performance Reports, our Hub is home to Advanced Reports that help you uncover more insights about your content and audience.
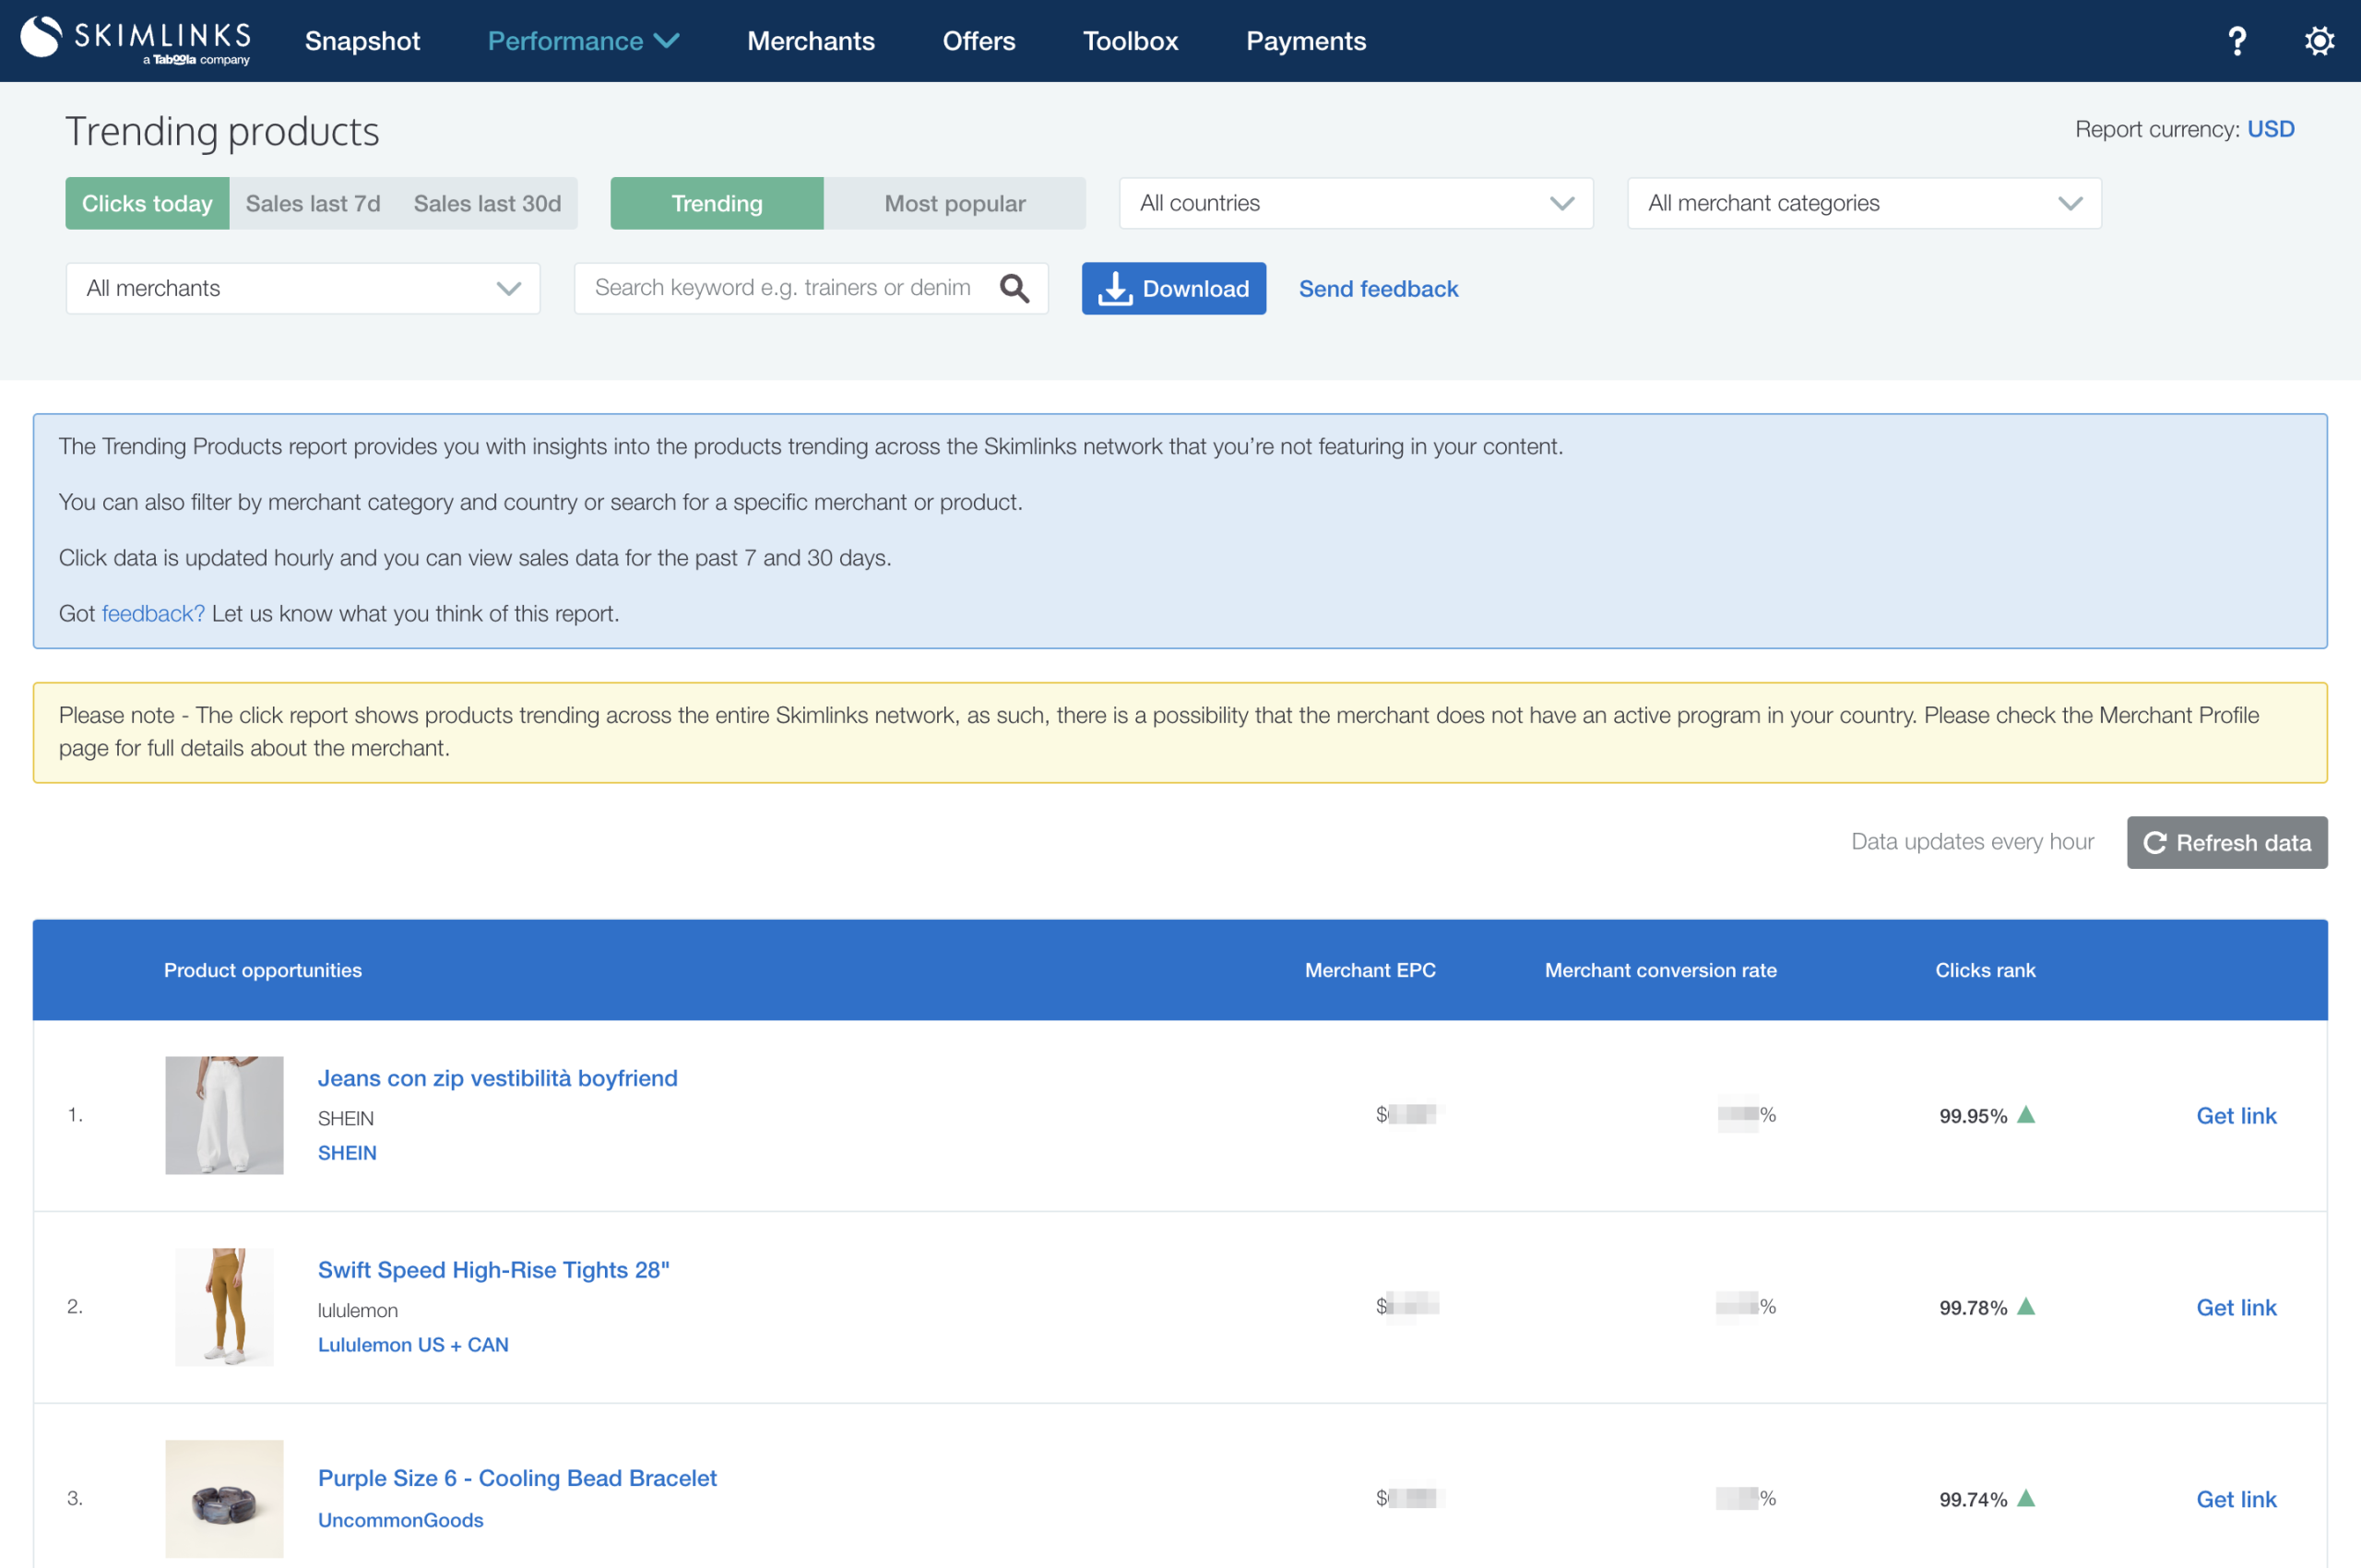
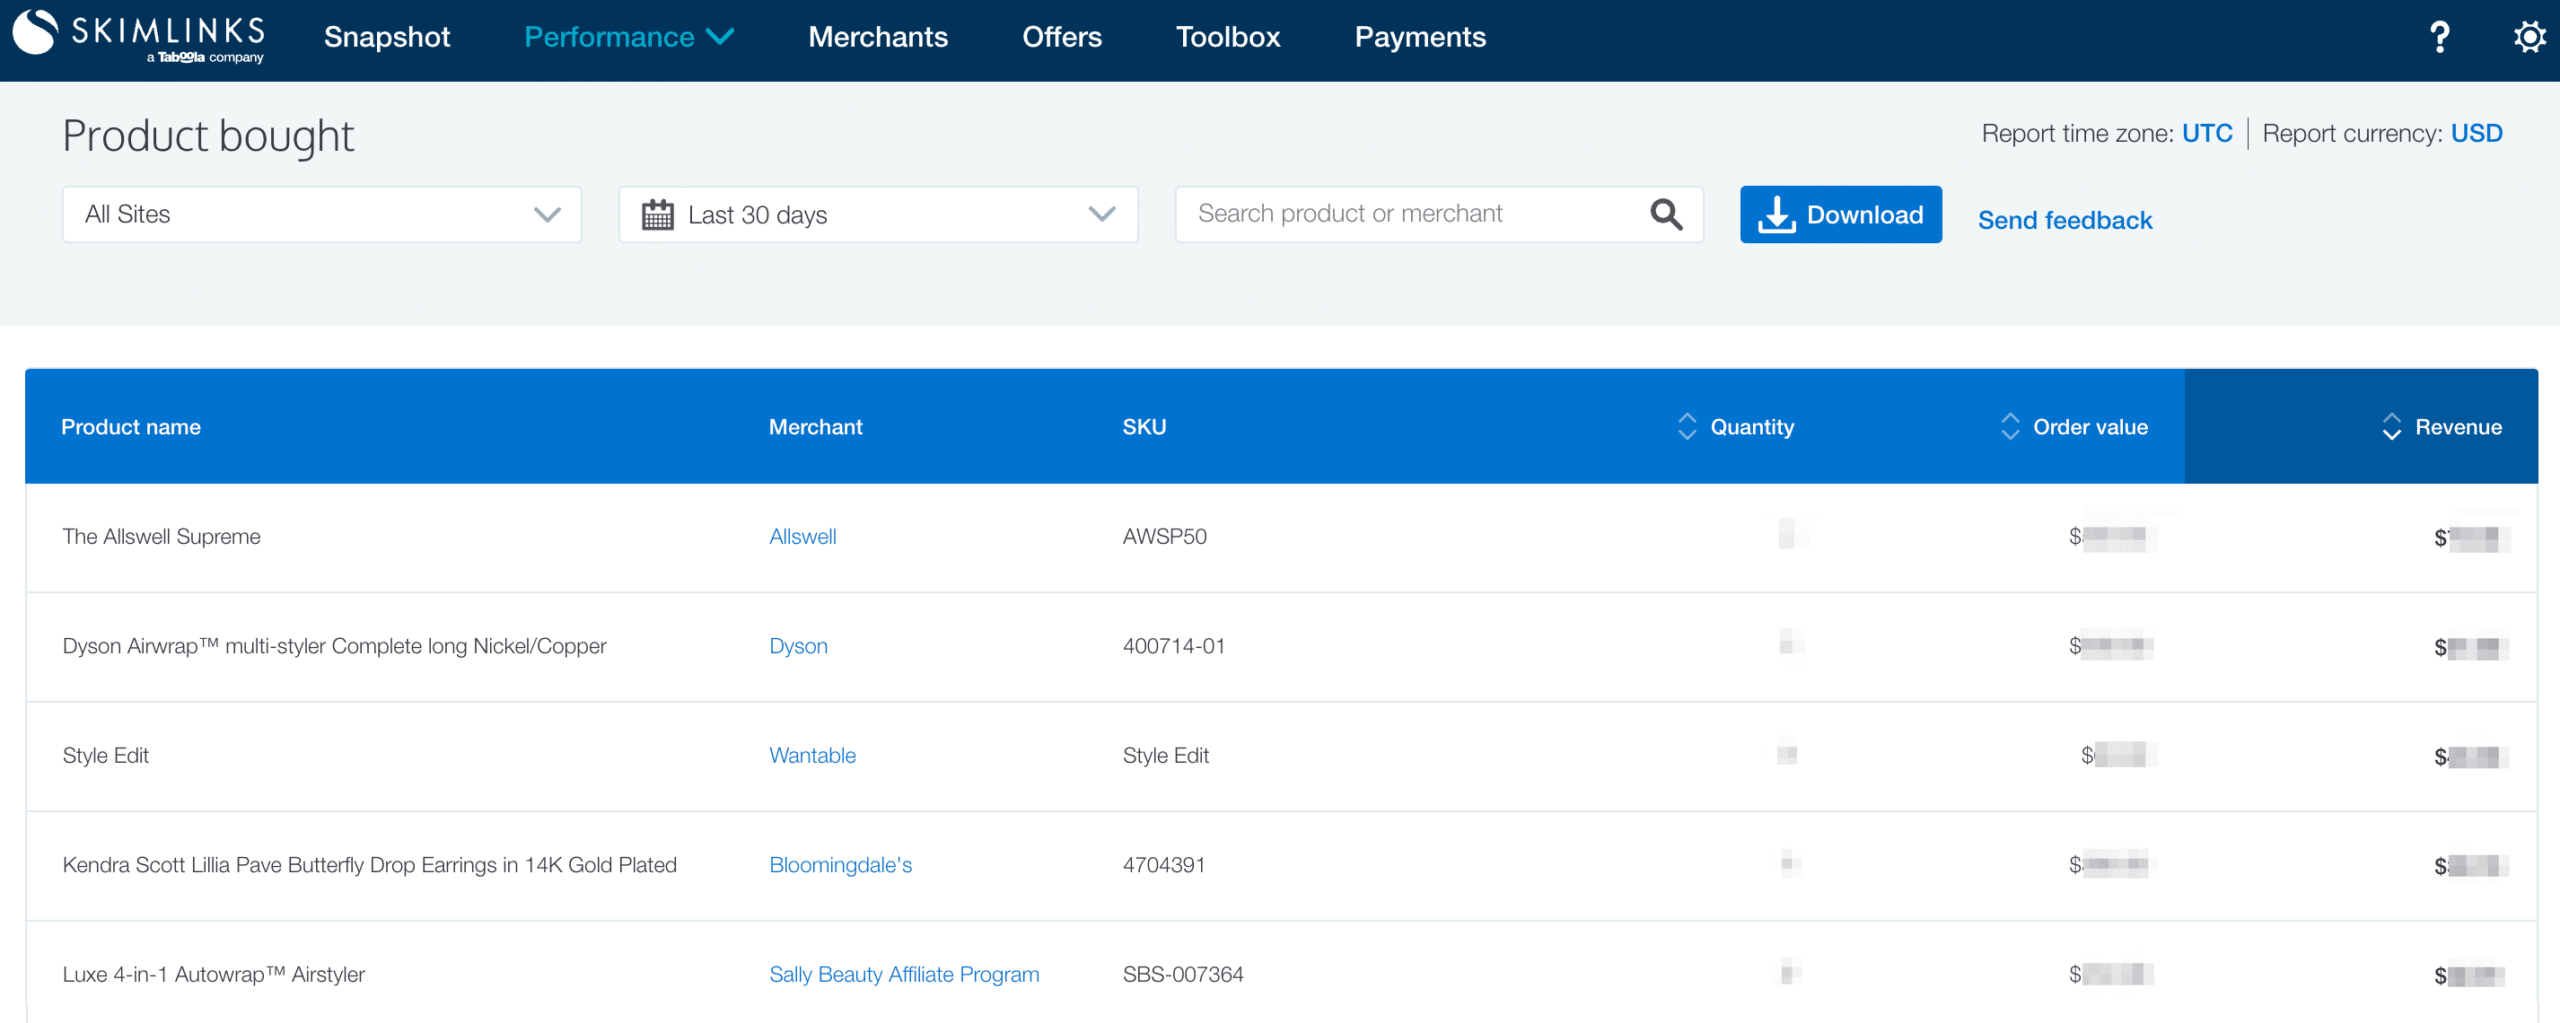
Create – Looking for inspiration for a new post? Use the Trending Products Report and Product Bought Report together to plan which products to feature based on what’s performing well now and previously.
- Product Bought – see which products your readers bought after clicking through from your content, even if it’s different to what was featured.
- Trending Products – see which products that you’ve not featured are trending across the Skimlinks network to help you create reactive, relevant content.
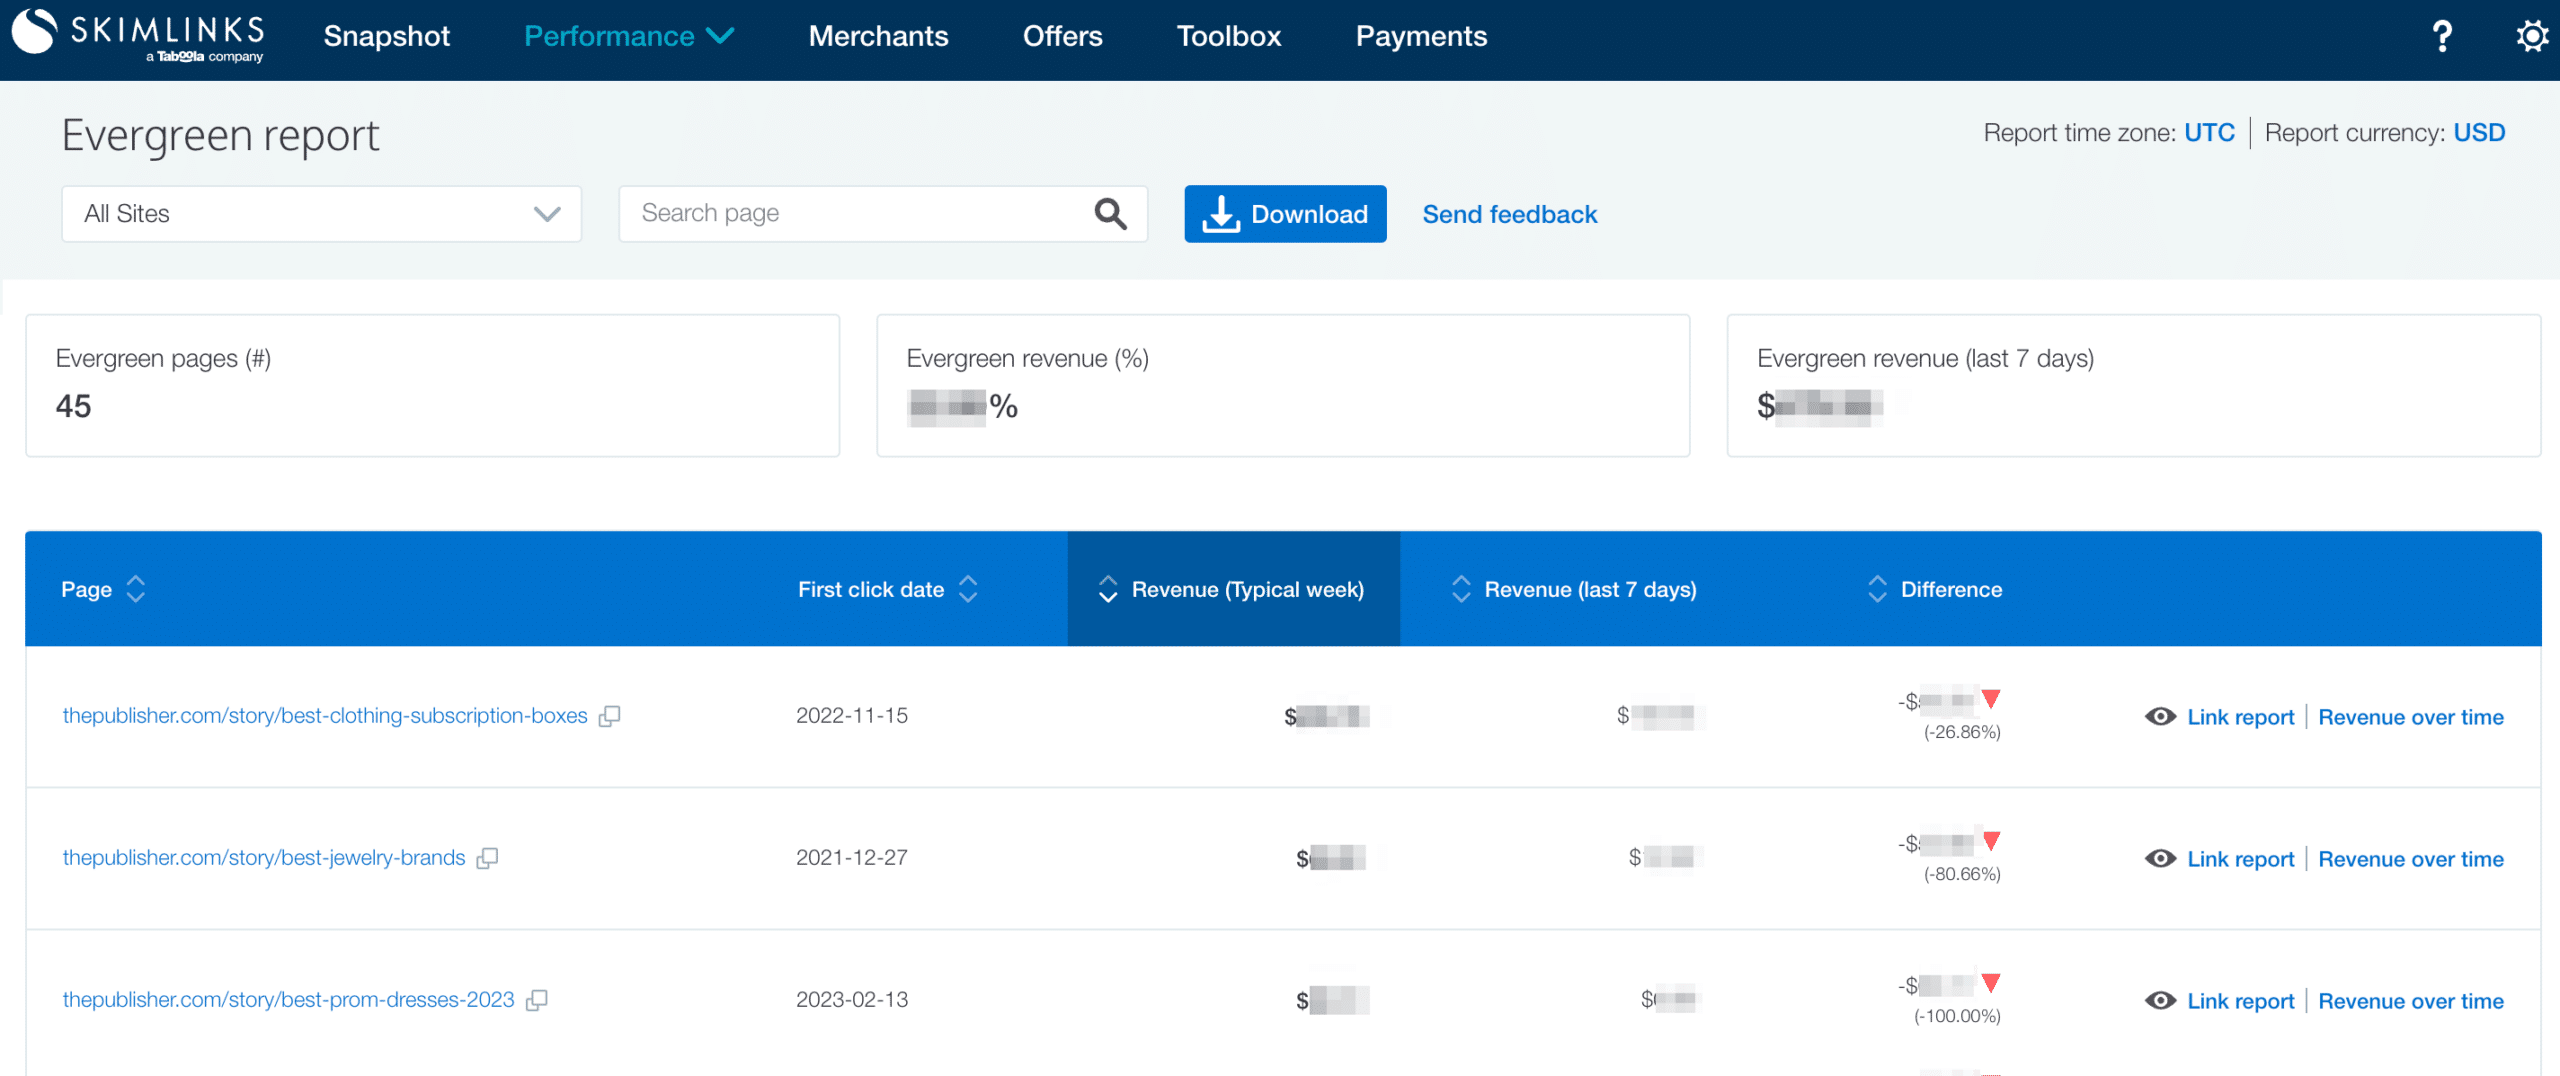
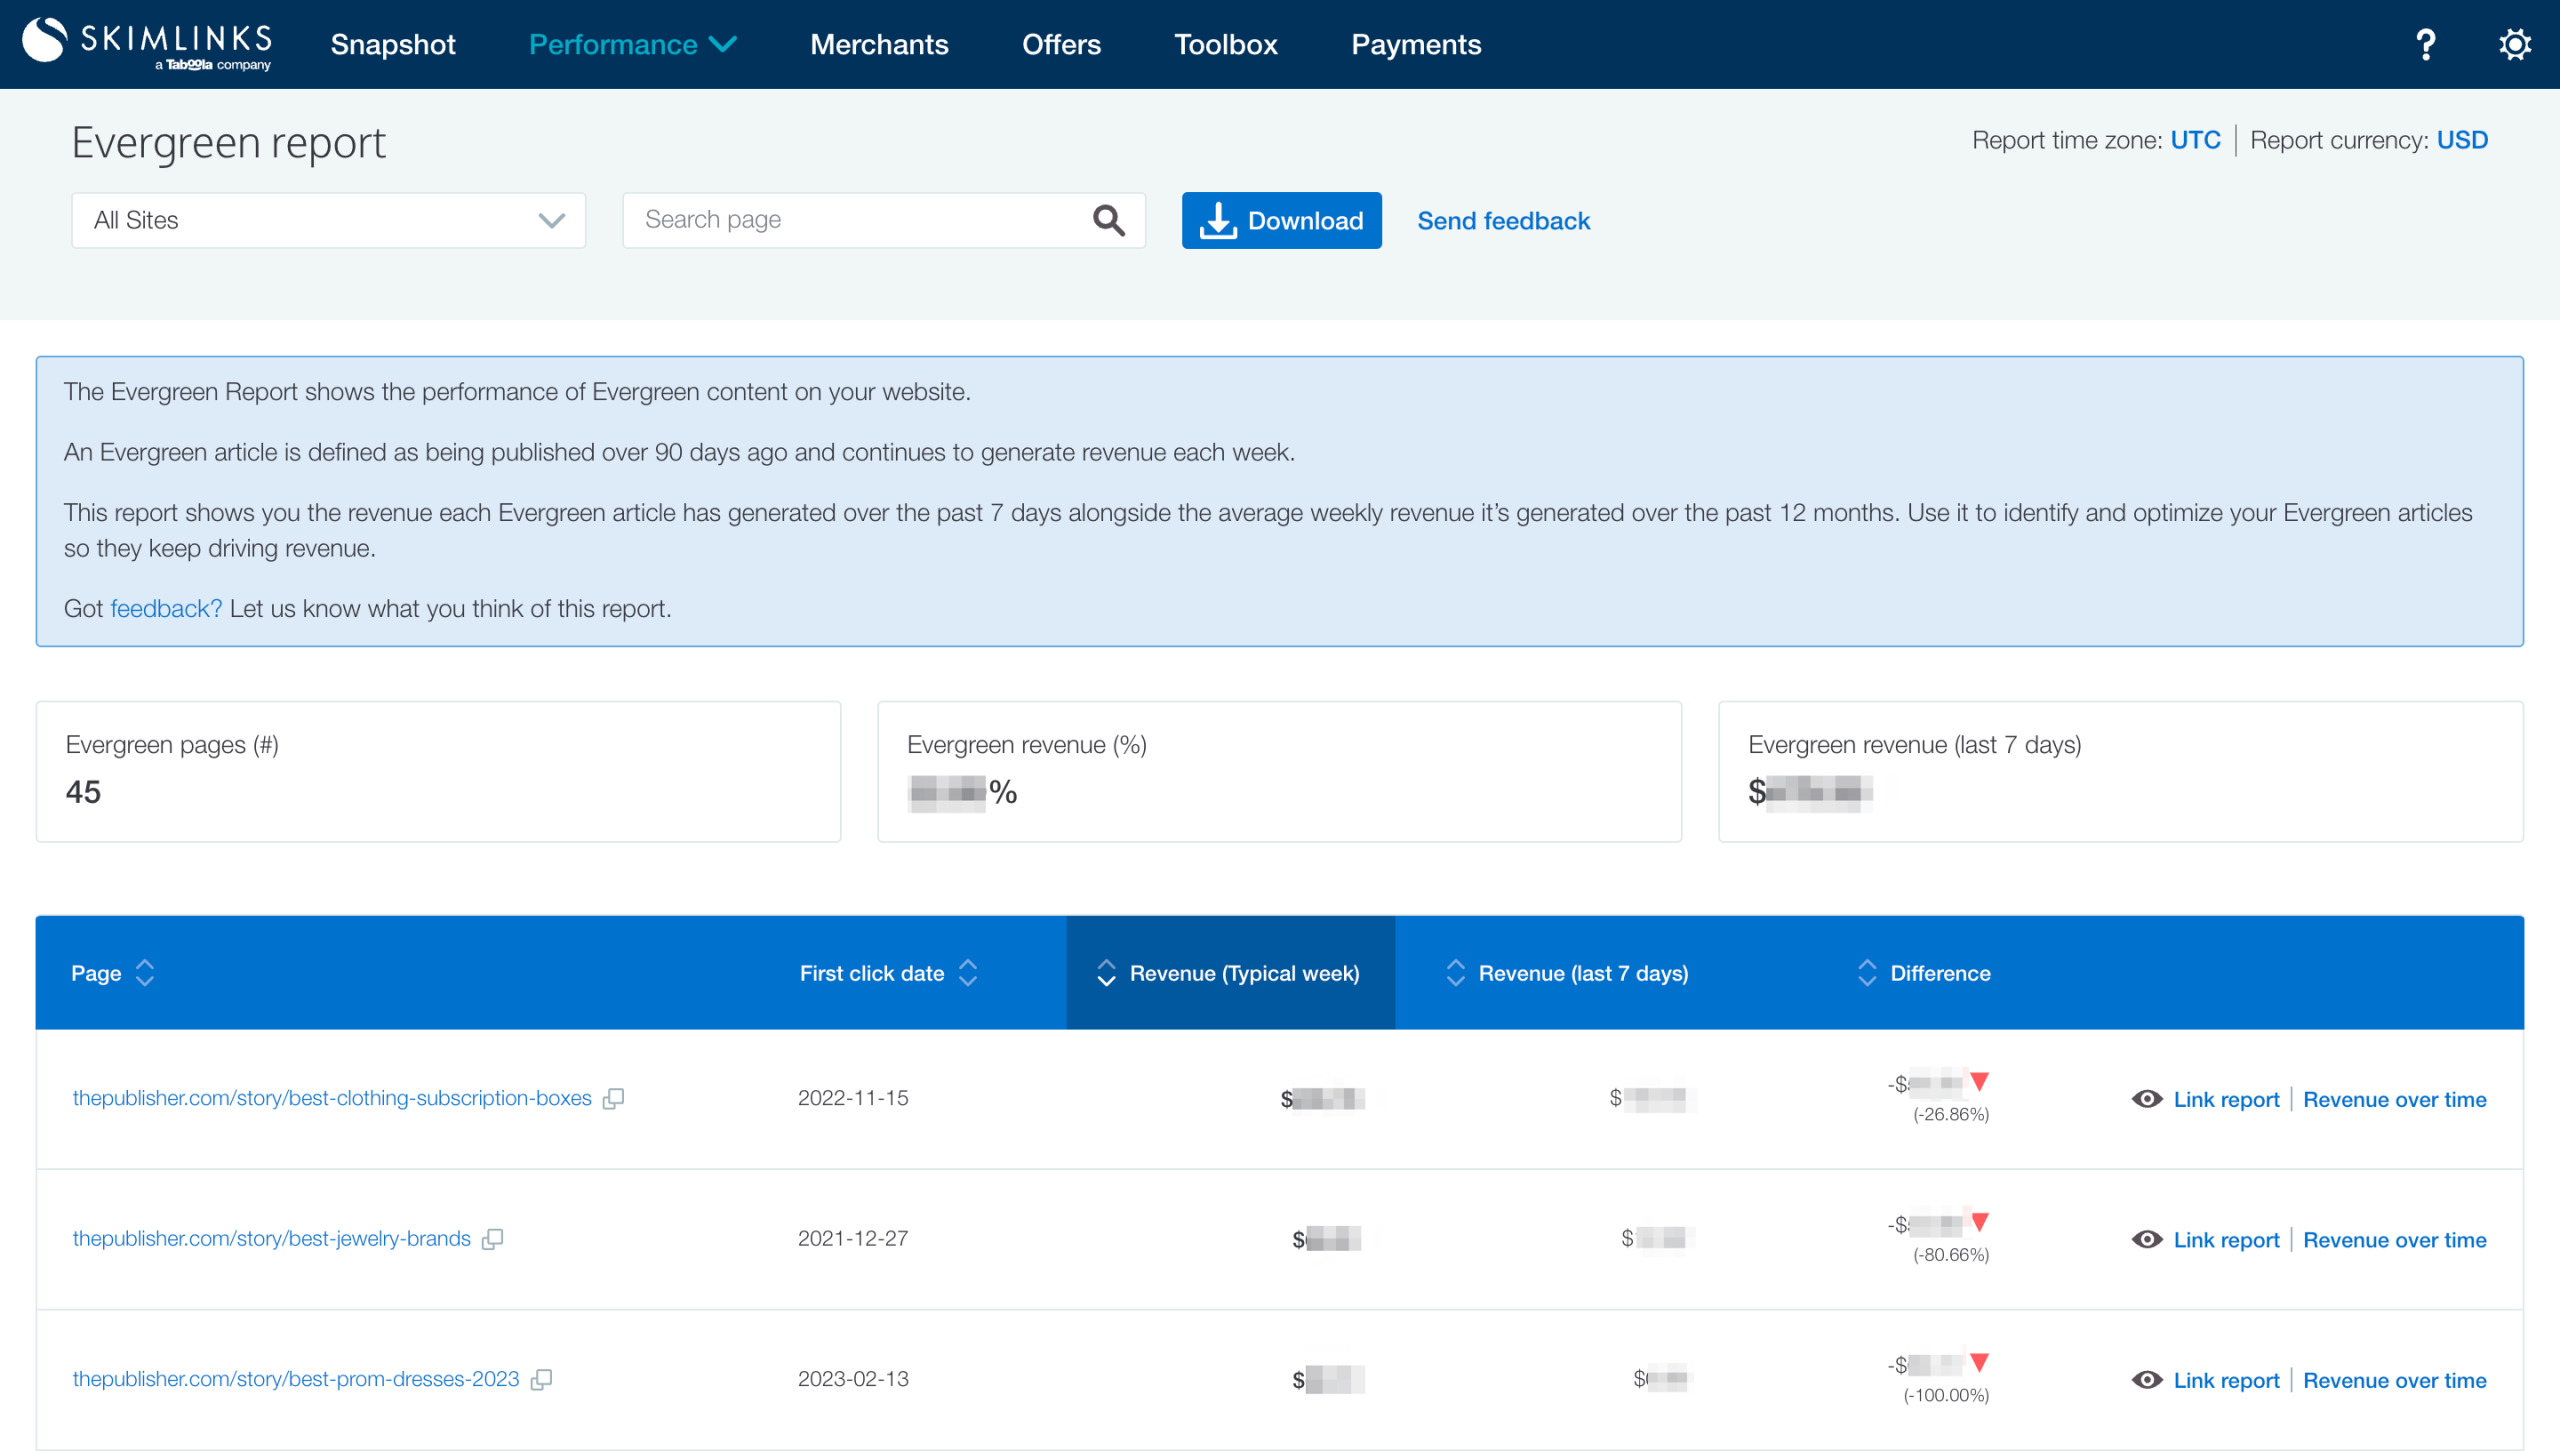
Upcycle – You don’t always have to create new content! The Evergreen Report and Broken Links Report helps you make the most of your existing content, so it keeps earning commissions month after month.
- Evergreen – see which of your older articles consistently drive revenue so you can ensure the content and products are up-to-date
- Broken Links – see which links are broken due to an out-of-stock product, 404 redirects, and inactive merchants. Update them to make sure you’re not missing out on commissions – or enable Dynamic Link Optimization (DLO) and your out-of-stock, 404 redirect and inactive merchant broken links will update automatically, so you can keep driving revenue. Please note, DLO for out-of-stock and inactive merchants is available in the US only.
- Link Optimization – see how much additional revenue you’ve earned from DLO automatically updating your broken links.
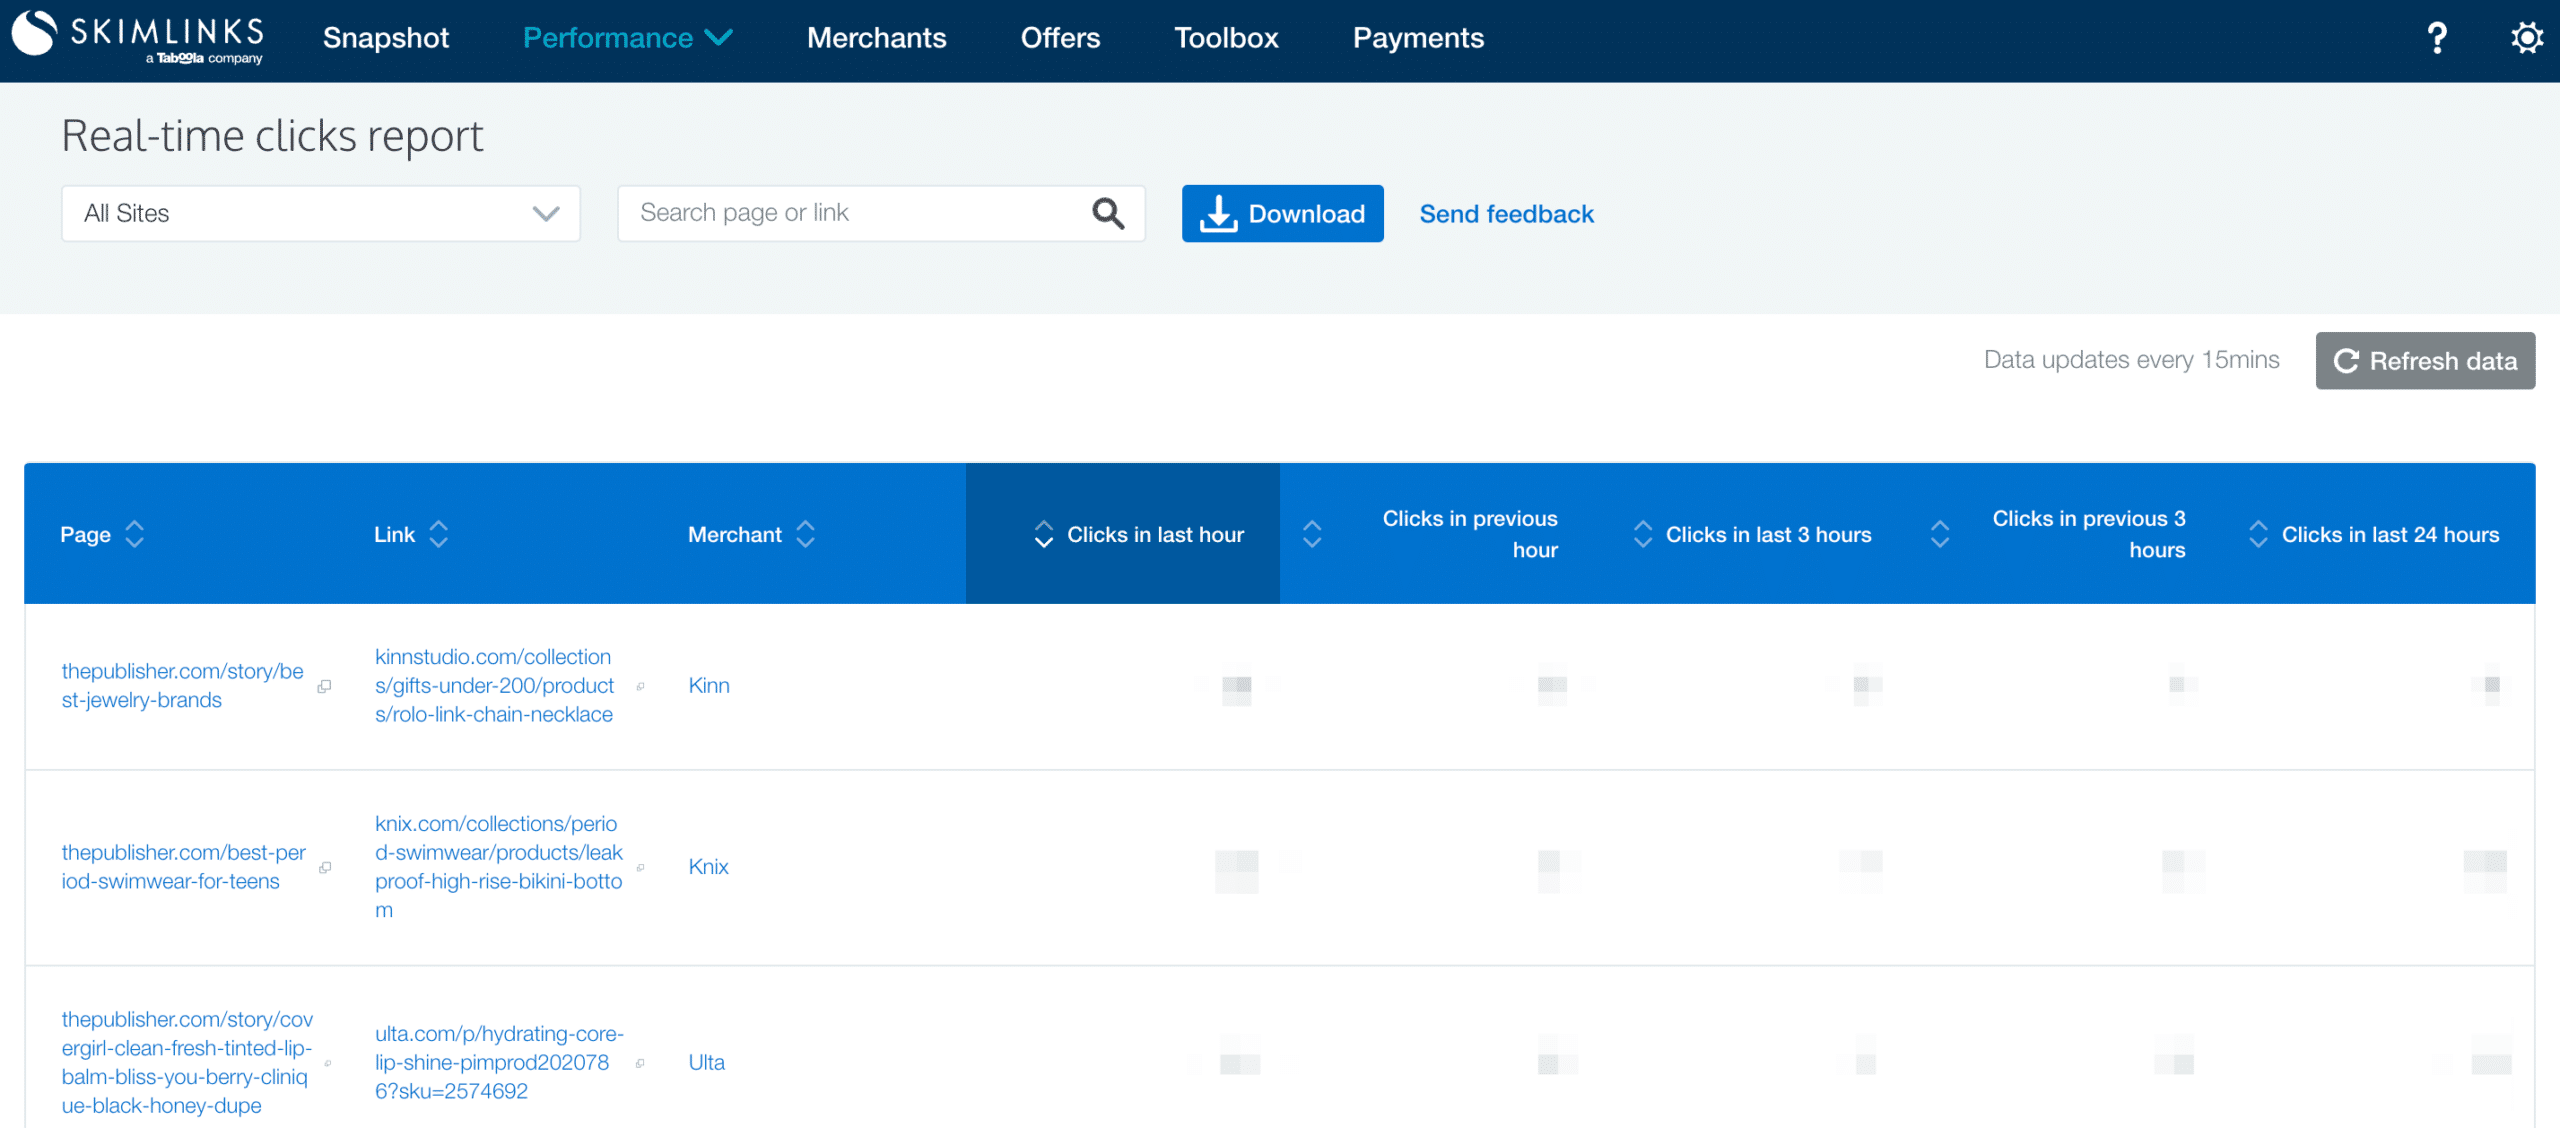
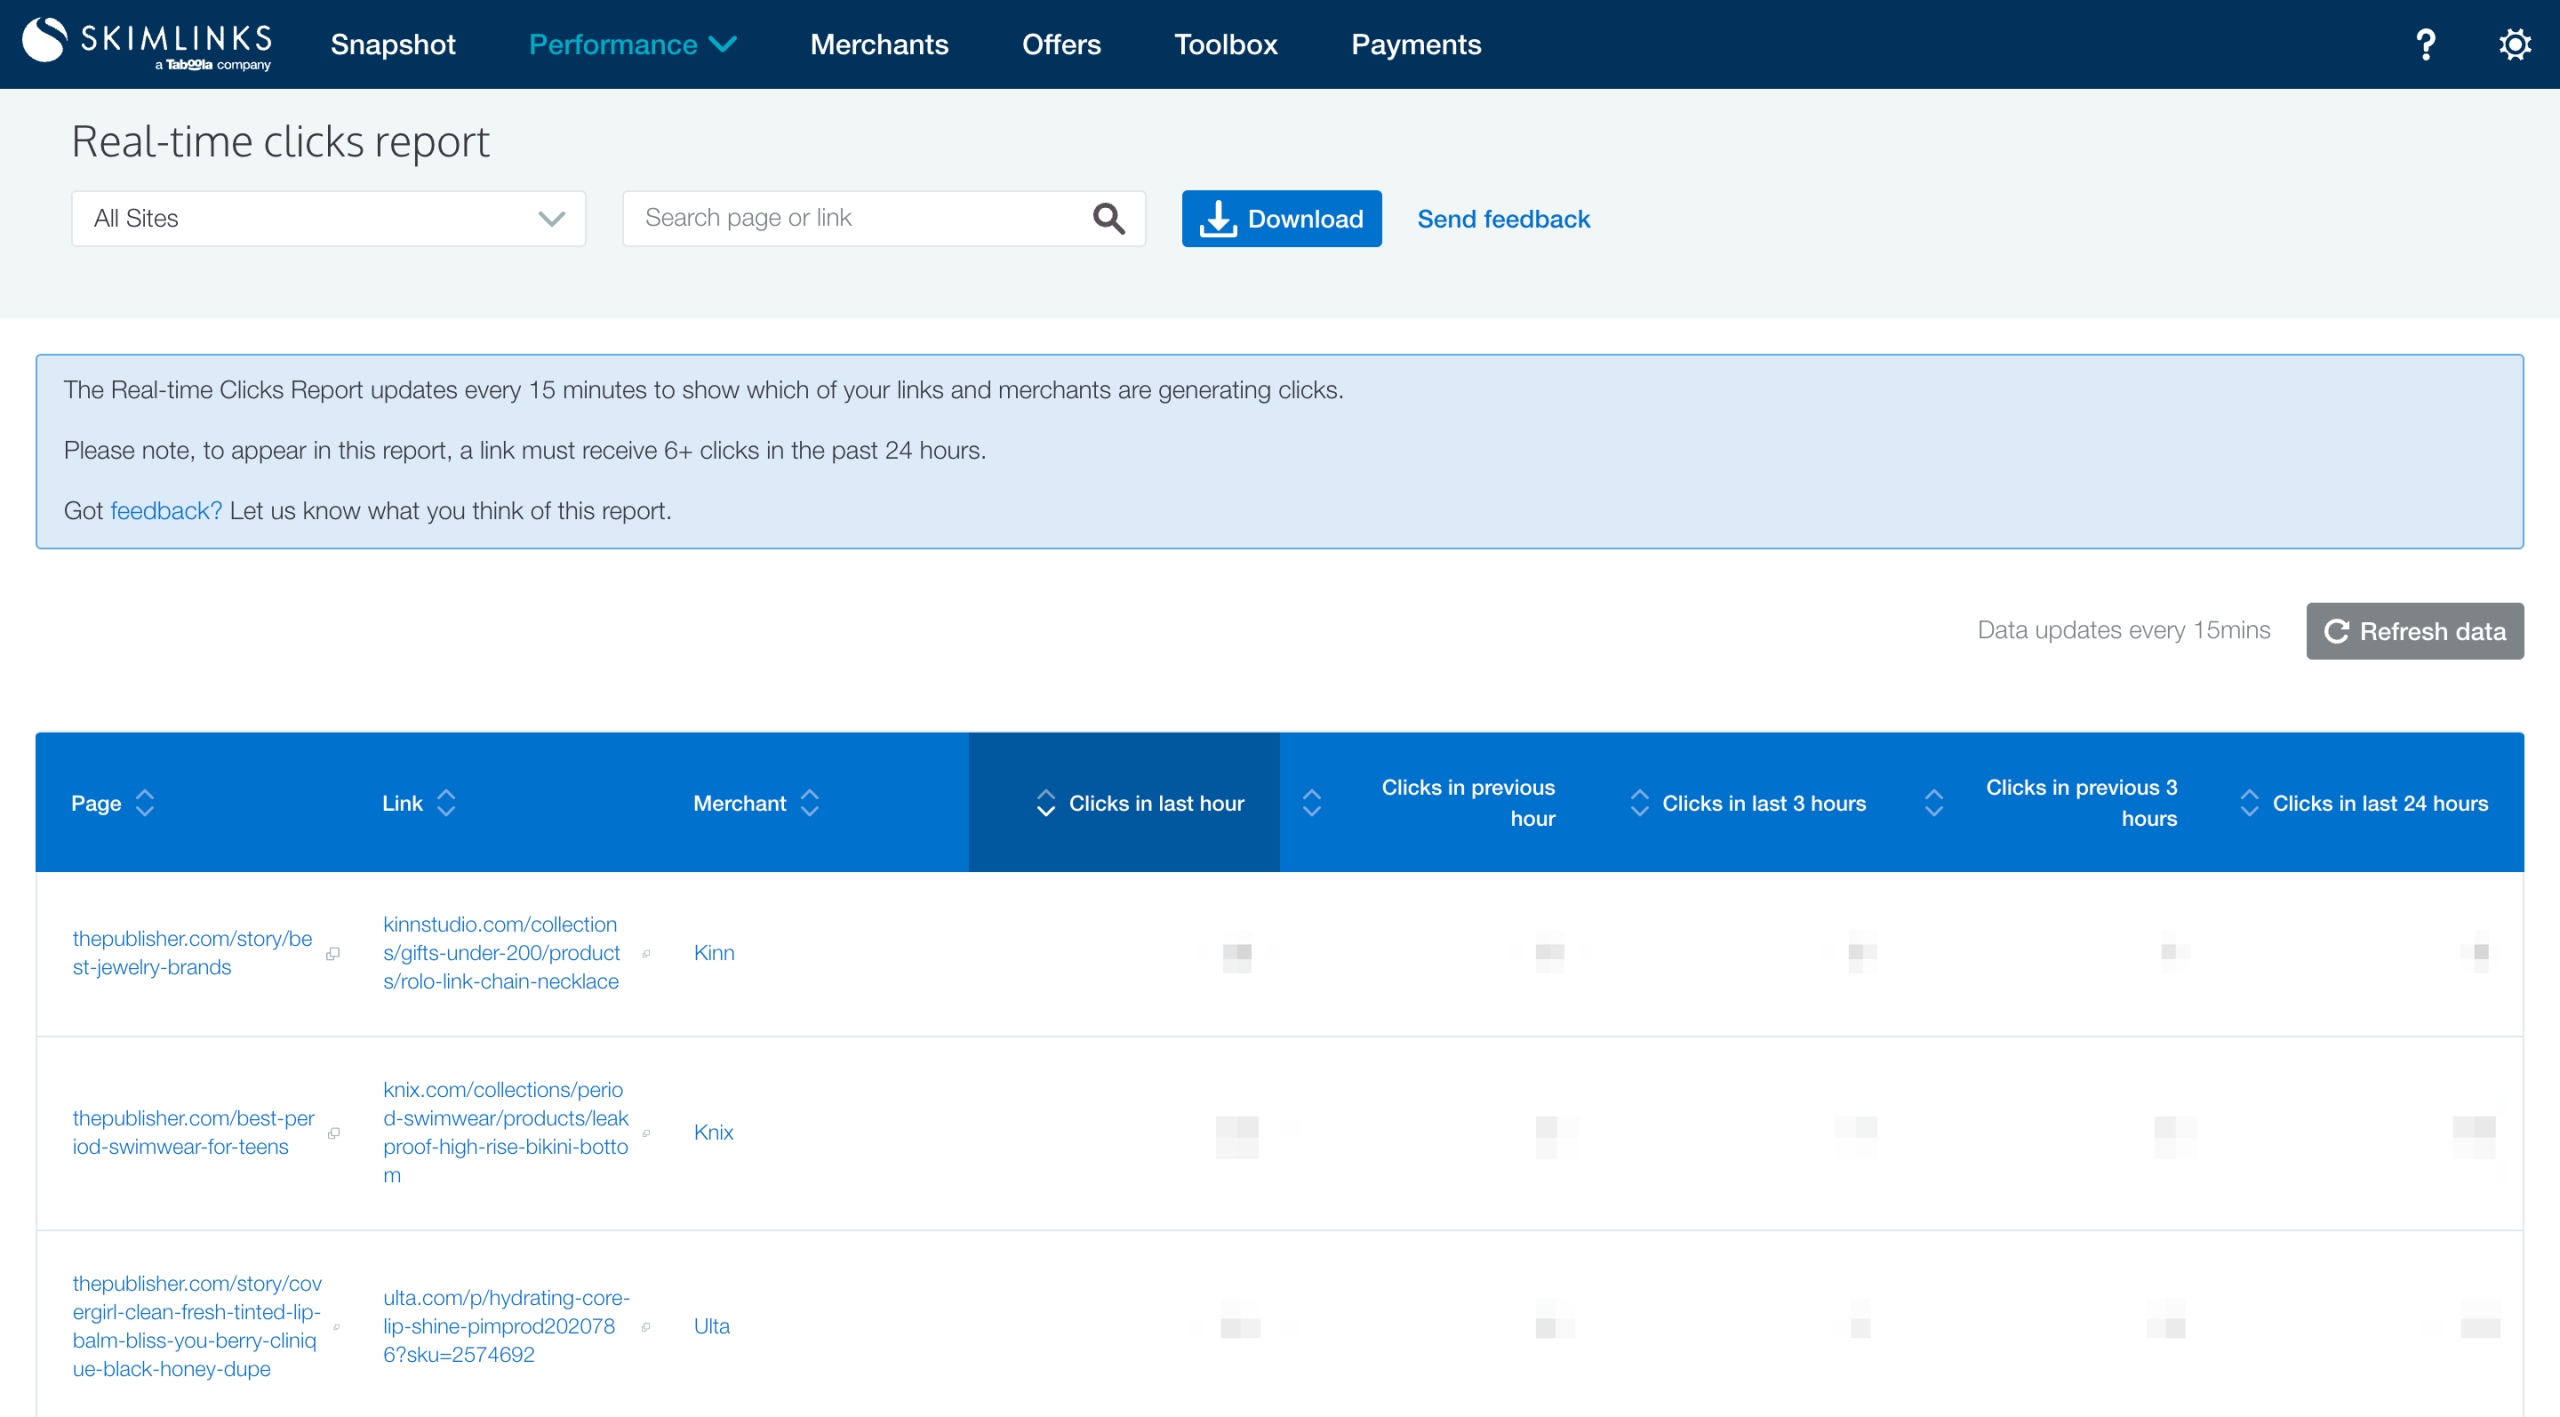
Optimize – Spot opportunities to drive more traffic and sales from your existing content with the Real-time Clicks Report and Revenue Source Report.
- Real-time Clicks – see which of your links are getting the most clicks in real-time, especially useful on key shopping days to track content that’s performing well and could be promoted more
- Revenue Report Builder – see the source of your sales, so you can track your own KPIs and see which activities drive commissions and which channels, platforms and placements perform best.
There’s no technical work required to use the Performance Reports – simply log into the Publisher Hub to view all your reporting in one place.
Stay one step ahead
Tracking your performance closely is vital for knowing how your commerce content is performing, what content resonates best with your readers, and where there are opportunities to optimize.
Skimlinks is here to help you uncover trends in your own performance as well as valuable insights from around the industry, so you’re always equipped and set up for success.