
Compare Your Performance Over Time
Publishers need to compare their current performance to previous periods to gauge success and make more informed decisions. The Comparative Reporting feature in the Publisher Hub enables Publishers to do just that!
Simply go on the date selector on any of the core performance reports and select ‘compare to previous’ to enable the new feature. This will enable Publishers to:
- Compare your performance to previous: period – compare your performance from a chosen period to the same period preceding it. For example, compare performance from the last 30 days to the 30 days before that.
- Compare your performance to previous: year – compare your performance from this year to the same period last year. For example, compare the performance from the last 30 days to the same calendar dates from the year before.
- Compare your performance to previous: custom – compare your performance from your chosen periods. For example, compare the performance from the last 30 days to any other time frame of any amount of days.
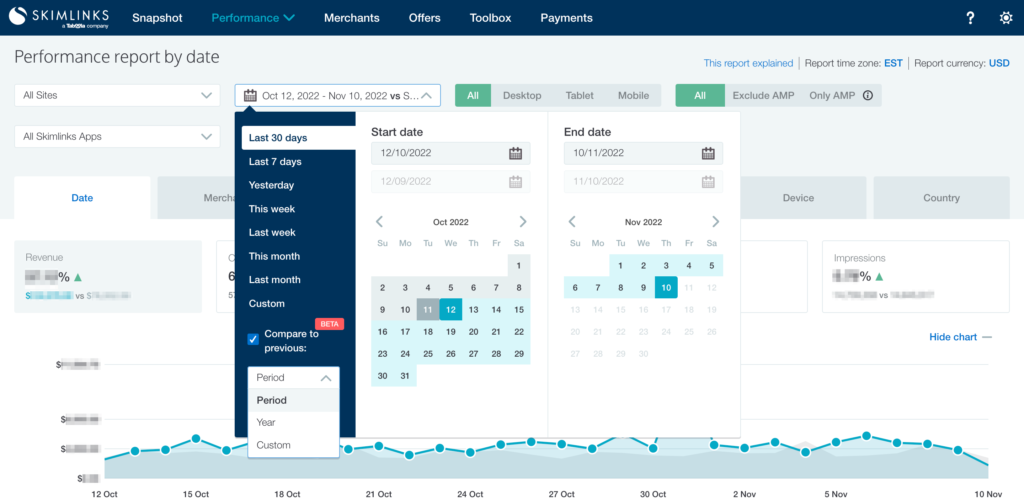
Comparative Reporting is available on all Core Performance reports, including date, merchant, page, link, site, device, and country.
The feature is also available for CSV downloads when enabled – this means that Publishers no longer need to download different reports and manually compare the data.
Report by Date
The Report by Date allows Publishers to track their performance over time.
By enabling the Comparative Reporting feature, Publishers will automatically view changes in performance across two periods in:
- Revenue
- Clicks
- Sales
- Order Value
- Impressions
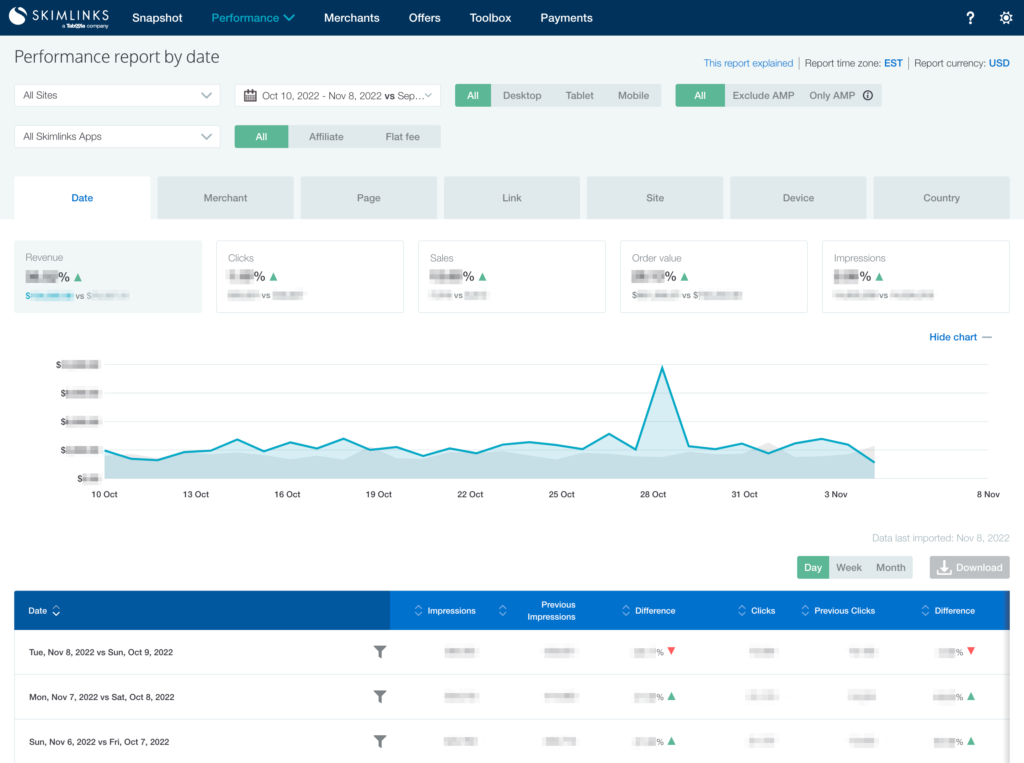
Publishers can also view a full breakdown by day / week / month and delve into the difference between:
- Impressions and previous impressions
- Clicks and previous clicks
- CTR and previous CTR
- Sales and previous sales
- Conversion rate and previous conversion rate
- Order value and previous order value
- Revenue and previous revenue
- RPM and previous RPM
- EPC and previous EPC
Report by Merchant
The Report by Merchant enables Publishers to discover which merchants are performing best. The new Comparative Reporting feature allows Publishers to compare differences for their top merchants in:
- Clicks and previous clicks
- Sales and previous sales
- Conversion rate and previous conversion rate
- Order value and previous order value
- Revenue and previous revenue
- EPC and previous EPC
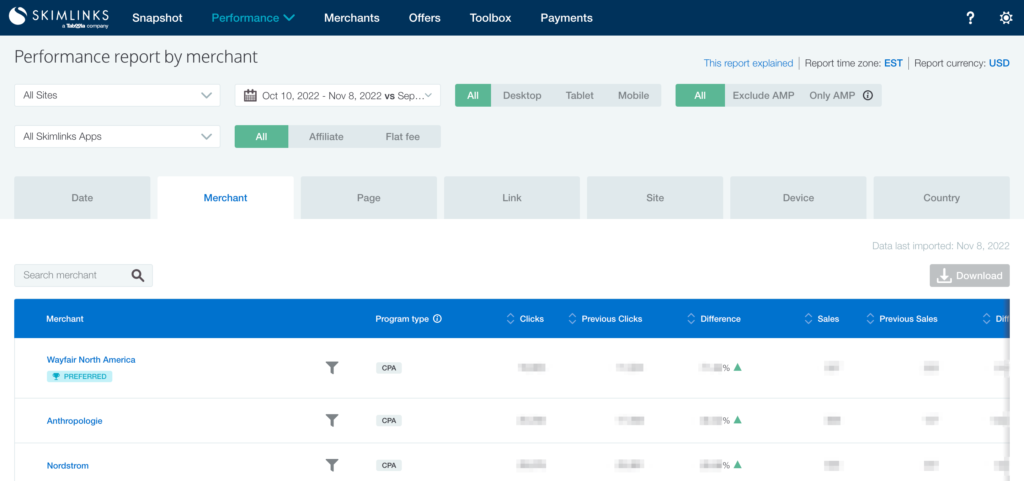
We recommend that Publishers click on the ‘difference’ column on the metric of interest, to understand which merchants their readers had increased interest in, and promote them more.
Report by Page
Interested to see which pages are continuously bringing high engagement? With Comparative Reporting Publishers can see if a page has become more popular over a period of time through changes in:
- Impressions
- Clicks
- CTR
- Sales
- Conversion rate
- Order value
- Revenue
- RPM
- EPC
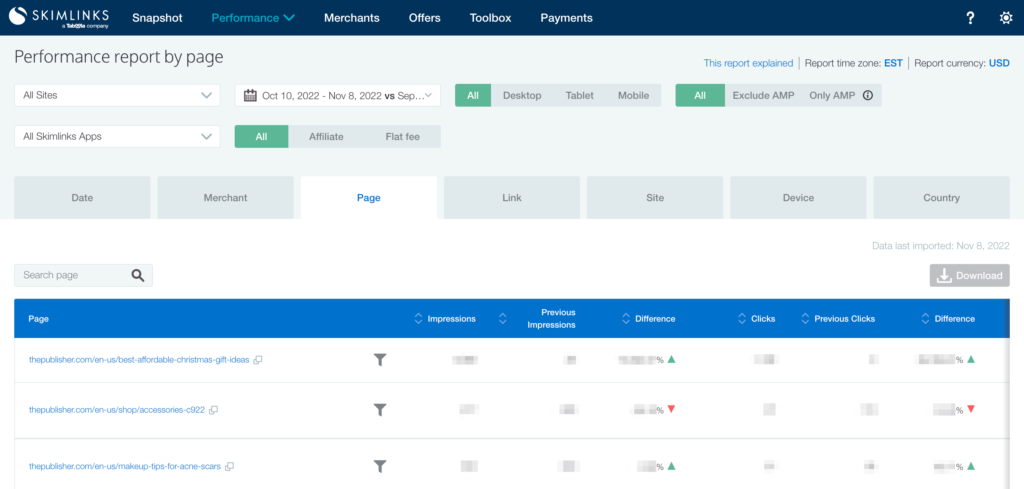
We recommend that Publishers use the data in the ‘difference’ column to view pages which have increased in clicks and revenue over the period to see which content your readers are engaging with – update with fresh links and promote them on social channels.
Report by Link
Which product links are converting well with your readers? With Comparative Reporting on the Report by Link, Publishers can view which links have gained interest from their readers over the period through changes in:
- Impressions
- Clicks
- CTR
- Sales
- Conversion rate
- Order Value
- Revenue
- RPM
- EPC
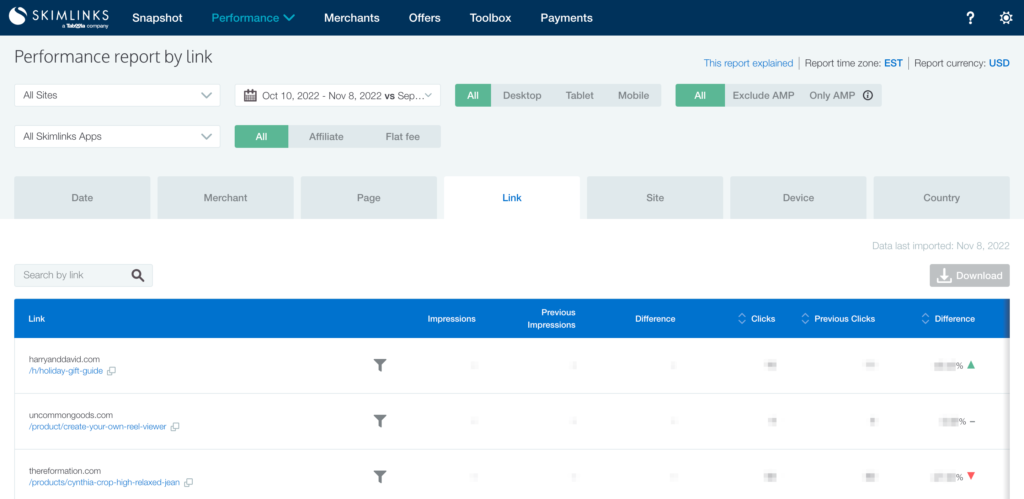
Publishers can use this data to understand which products their audience are buying before key shopping events, and promote these products or product alternatives.
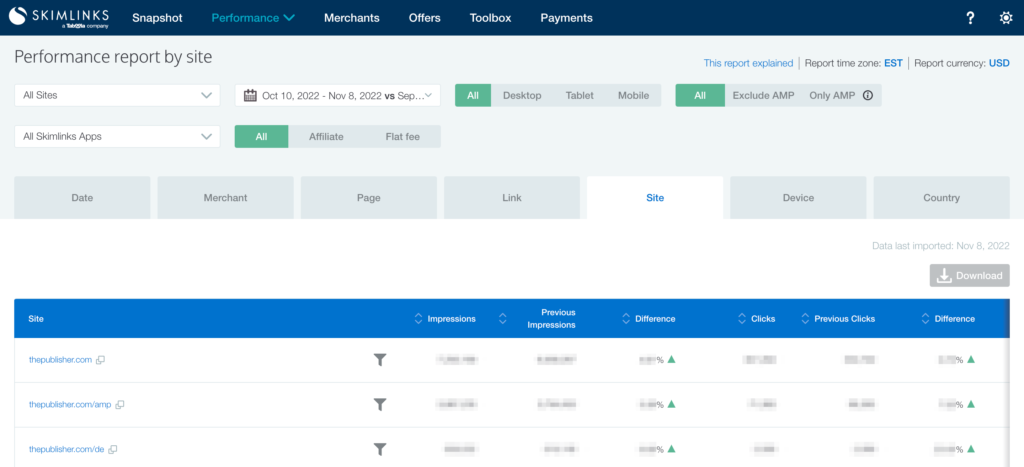
Report by Site
Viewing site performance is important to understand where your audience is consuming your content. Comparative Reporting enables Publishers to view changes in site performance over a period of time through changes in:
- Impressions
- Clicks
- CTR
- Sales
- Conversion rate
- Order Value
- Revenue
- RPM
- EPC
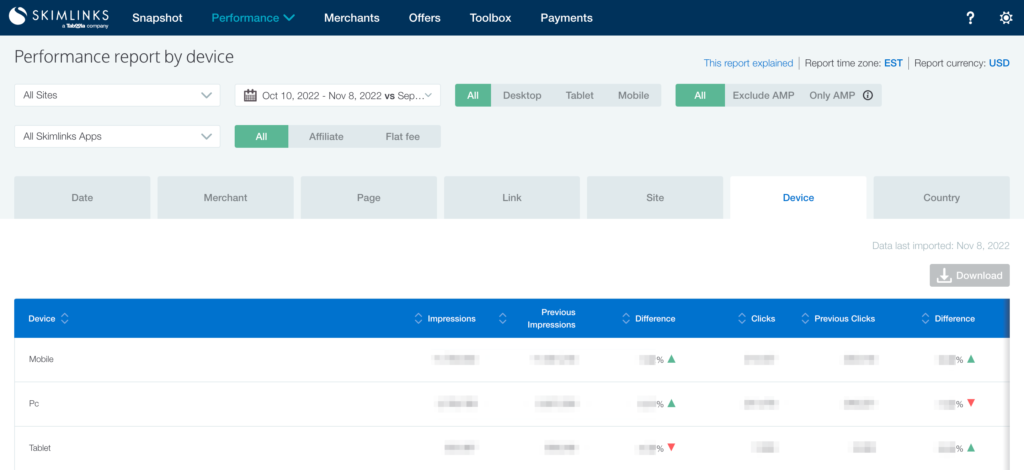
Report by Device
Are your readers starting to consume more content on mobile or tablet?
Comparative Reporting on Report by Device will help you find out how usage has changed over time and allow you to make content more accessible and device-friendly.
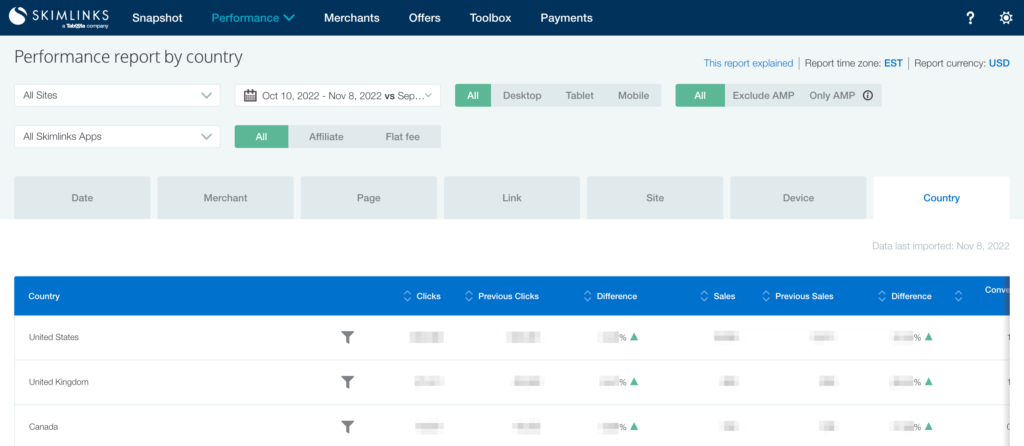
Report by Country
The Report by Country allows Publishers to view which countries drive the most engagement and revenue. Publishers can tap into new markets and unlock new revenue streams in countries where their content increased in sales, clicks, and more.
Ready to enable comparative reporting and make more informed decisions to maximize all revenue opportunities? Check out the Publisher Hub to explore more!